We all hear the reports: home prices are going up. The fact is all real estate is local. What happens in Venice or Sarasota bears little relationship to Cape Cod or Skokie. So, what is happening in Venice? Here are the facts: Prices are 15% higher than last year, but since February they haven’t changed much, varying not much more than 2% for the past ten (10) months. The homes that are selling are listed within 6% of the likely selling price, and since January are selling within 3 ½ months. The result is that inventory is low. We had our price surge from the market lows. It happened in February. If you blinked, you missed it. We have now reached market balance. Prices will increase no more than 2-3%. That is a good thing, as it creates stability in the marketplace and is in accordance with the 100 year average. I’ll take the certainty of the 100 year average, because I think that’s the basis upon which a reasonably prudent person can plan a life. So, if you are considering selling or buying a home, there is no reason to wait on the sidelines any longer. Rates are low, inventory is low, more sellers are realistic than not, buyers are plentiful, and prices will likely increase no more than 2-3%. 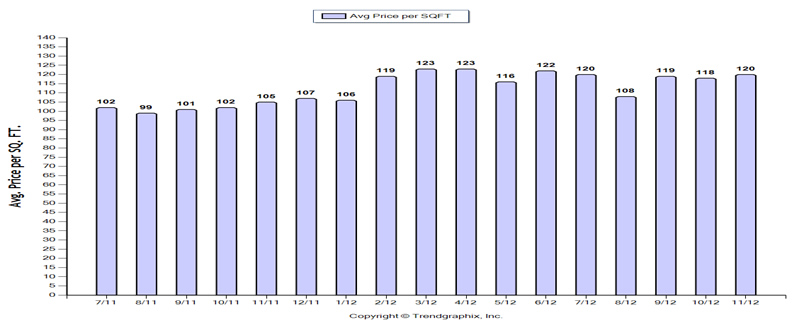 Homes for Sale --- As of November 30, 2012, there were 704 homes for sale, 8.5% more than the 649 homes for sale last month, but, 21.1% less than the 892 homes for sale one (1) year ago. New Listings --- There were 221 new listings in November and October, pretty close to the 216 new listings one (1) year ago. Pending Sales – Pending sales (under contract but not closed) are generally a reliable indicator of what will close over the next two (2) months. There was a 14.9% decrease in the number of pending sales --- on November 30th there were 149 pending sales, in October there were 175. Sold Homes --- Actual closings, i.e., sold homes increased 18.4% in November (149 sold homes) versus October (125). Sold Prices --- At an average square foot price of $120, November experienced a 2% increase over October’s $118/sq. ft. sold average, and a 14.4% increase over the $105/ sq. ft. average one (1) year ago. The breaking point was February 2012, when prices spiked 11%, to $119/sq., from January’s $106. But, since the February spike there has been very little movement --- for the last 10 months the average sold price has been $118.80/sq. ft. Inventory --- Months of inventory based on closed sales went even lower: in November inventory dropped to only a 4.8 month supply; in October it was 5.2 months, and one (1) year ago it was 8.3 months --- a 42.4% year over year drop. Six to seven months is considered a balanced market. Average Days on Market | Sold vs. List Price% --- Indicative of stable prices and low inventory, homes are selling when they are listed close to the likely selling price. 87 homes sold on average in November, down from 111 days in October. There was only a 6% spread between the sold and list price. Above 10%, homes languish on the market as buyers wait for the price to drop, with few showings, no offers.
Homes for Sale --- As of November 30, 2012, there were 704 homes for sale, 8.5% more than the 649 homes for sale last month, but, 21.1% less than the 892 homes for sale one (1) year ago. New Listings --- There were 221 new listings in November and October, pretty close to the 216 new listings one (1) year ago. Pending Sales – Pending sales (under contract but not closed) are generally a reliable indicator of what will close over the next two (2) months. There was a 14.9% decrease in the number of pending sales --- on November 30th there were 149 pending sales, in October there were 175. Sold Homes --- Actual closings, i.e., sold homes increased 18.4% in November (149 sold homes) versus October (125). Sold Prices --- At an average square foot price of $120, November experienced a 2% increase over October’s $118/sq. ft. sold average, and a 14.4% increase over the $105/ sq. ft. average one (1) year ago. The breaking point was February 2012, when prices spiked 11%, to $119/sq., from January’s $106. But, since the February spike there has been very little movement --- for the last 10 months the average sold price has been $118.80/sq. ft. Inventory --- Months of inventory based on closed sales went even lower: in November inventory dropped to only a 4.8 month supply; in October it was 5.2 months, and one (1) year ago it was 8.3 months --- a 42.4% year over year drop. Six to seven months is considered a balanced market. Average Days on Market | Sold vs. List Price% --- Indicative of stable prices and low inventory, homes are selling when they are listed close to the likely selling price. 87 homes sold on average in November, down from 111 days in October. There was only a 6% spread between the sold and list price. Above 10%, homes languish on the market as buyers wait for the price to drop, with few showings, no offers.