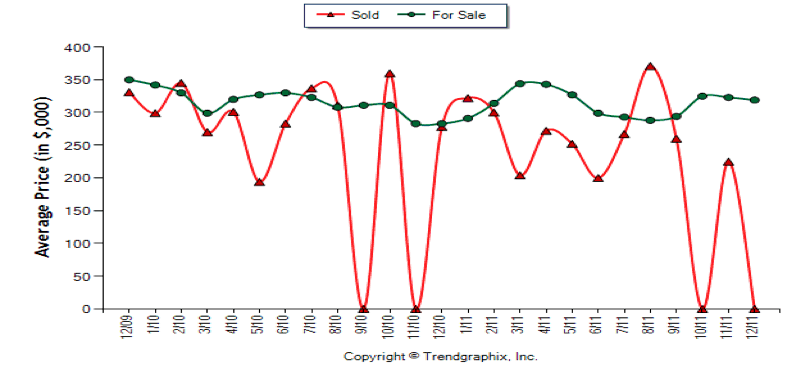
The Lakes of Jacaranda is a resilient and desirable community. However, it is not immune from the challenges faced by a depreciating real estate market. In 2010 the average active list price was $315,000, at a time when the average sold price was $290,000. This represented an 8% difference between the average list price and the average sold price. As a general rule, homes will sell when the spread between the list price and fair market value (sold price) is less than 10%. The result was that at the Lakes 2010 delivered solid sales results as measured by the number of homes sold. The same cannot be said for 2011. There were substantially the same number of homes available for sale in 2011 as in 2010; an average of 11 on any given day. Nevertheless, there was a precipitous drop in sales. There were 66.7% less sales in 2011 than 2010. Only 16 homes sold in 2011. In 2010, 27 homes sold. The reason is that in 2011 the average list price was $313,000, similar to 2010’s $315,000 average. However, the median value of homes sold in 2011 dropped 8.6% to $265,000. This represented a 14% difference between the average list price and the average sold price in 2011. Basically, too many sellers refused to believe what the market was telling them --- prices dropped and they were priced to high. The result was that in 2011 too many homes languished on the market unsold, “chasing the market down”.
- Homes for Sale - On average there were 11 homes for sale on any given day in 2011; the same as in 2010.
- Sold Homes – Dropped 66.7% in 2011; 16 homes sold in 2011, 27 in 2010.
- Average Price per Square Foot – Down 5.8% in 2011; it averaged $122/sq. ft. in 2011, $130/ sq. ft. in 2010.
- Average Active List Price – Fundamentally the same, a 0.6% drop; $313,000 in 2011, $315,000 in 2010.
- Average Sold Price – Lower by 8.6%; $265,000 in 2011, $290,000 in 2010.
- Percentage Difference Between the Selling Price and the Final List Price – Up 2.1%; as to homes which sold in 2011, on average there was a 7% spread between the selling price and the final list price; in 2010 the spread was 5%. This is in accordance with the general rule that a home will sell when the list price is within 10% of its fair market value (selling price).
- Days on the Market: As to homes which sold, they were on the market for 16.1% longer in 2011 versus 2010; 101 days in 2011, 87 days in 2010.
- Months of Inventory (Based on Closed Sales) – A 200% increase; in 2011 the average monthly inventory of homes for sale, based on closed sales, rose to 11 months; in 2010 the average monthly supply was only 3.7 months. A 6 month inventory is considered a fairly balanced market between buyers and sellers.