What does this mean for you? Prices, both listed and sold, have stabilized over the last 6 months. There are currently fewer properties available for sale than at any time in more than a year. As we head into the prime selling/buying season, inventory will drop as closed sales increase. This all bodes well for a robust selling season, outpacing last year’s unit sales; provided, however, sellers listen to the market and price competitively. Number of Homes for Sale: 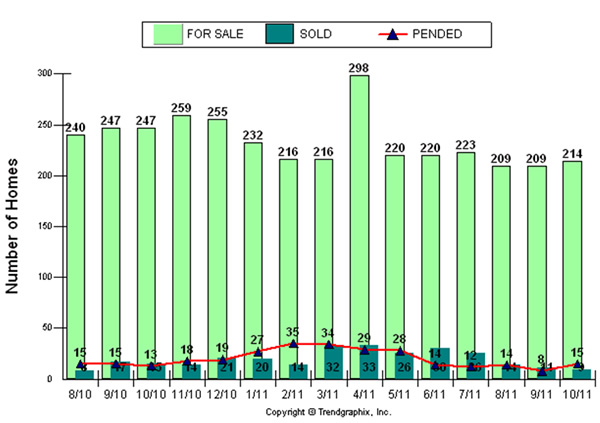
- As of October 31, 2011, there were 214 homes for sale on Venice Island, 6% less than the year to date monthly moving average. Discounting the isolated spike in April, October homes for sale are currently within 2% of the averages reached for the year.
- Sales slowed down: there were only 9 sales this past month, the slowest month since the 8 sales in August 2010. There were 40% less sales this past month, versus the 15 sales in October 2010.
- This has resulted in a 23.8 month supply of inventory, homes available for sale based on closed sales. A 6 month supply is generally considered a market in a state of equilibrium, a fair balance between sellers and buyers.
- The silver lining is that pending sales, i.e. sales under contract, increased 87.5% in October (15 pending) from the previous month (8 pending). As a general rule, pending sales are often a reliable indicator of closing activity for the ensuing 2 months; as pending goes, so go sales. Further, there was a sharp increase in the number of new listings for the month of October 2011; 43 new listings, compared with 27 in September and an average of 26 for the prior 5 months. This indicates that closed sales are likely to show marked improvement as we approach year’s end, which should correlate to a material reduction in inventory from its current 23.8 month supply.
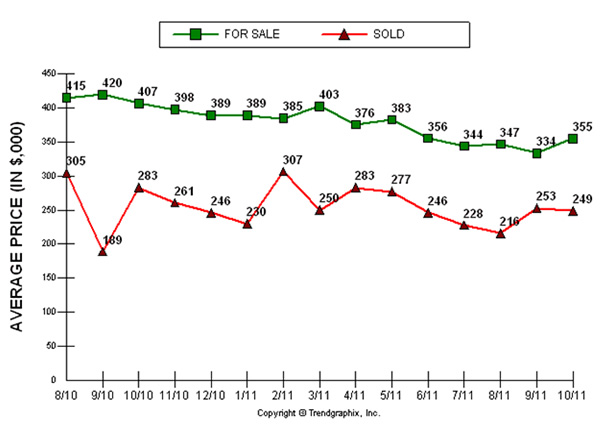
- Prices have come down for both active listings and sold properties.
- The average list price for the most recent month, October 2011, was $355,000. Although, this was up from the prior month’s year to date low of $334,000, it remains 4.2% below the prior 9 month combined average list price of $369,000.
- The average sold price was $249,000 in October, 2% less than the average sold price of $254,000 from January through September of this year.
- In particular, price volatility may be easing, as the market pricing for both active listings and sold properties have stabilized. October’s average list price of $355,000 is in line with the prior 6 month average of $356,000. Likewise, the average sold price of $249,000 in October was only $1,000 less than the April through September average of $250,000.