Search

Categories

    Tags

      Month

        Blog :: 2013

        Venice: Real Estate Sales Marketing Report, November 2013

        List Prices are Neutral while Sold Prices are Appreciating.

        Logic would seem to dictate that if homes are selling for more money, then list prices should go up as well.  Well, list prices are going up.  But, whereas sold prices have had double digit appreciation, list prices have had modest single digit appreciation. So, how do we explain [...]

        Venice: Real Estate Sales Marketing Report, October 2013

        Inventory Levels Stay Neutral – Price Appreciation is Moderating.

        In October, the number of homes available for sale, including new listings, closed sales and homes placed under Contract saw modest fluctuation from last month, but over-all no evidence of significant change.  The result is that the number of homes for sale based on closed [...]

        Venice – State of the Market Report – As of June 30, 2013: July 1, 2012 – June 30, 2013: 10.2% Price Increase

        July 1, 2012 – June 30, 2013:   10.2% Price Increase

        The pace of sold homes (closed) and pended sales (under contract) continue unabated. For most recent months, including June, sold and pended sales outnumbered new listings by a factor of at least two (2) to one (1).  Month in and month out there are simply not enough new listings to [...]

        Venice – State of the Market Report – As of May 31, 2013 – Year to Date: 10% Price Increase

        In Venice, there are fewer homes for sale; a lot fewer.  Almost 25% fewer homes for sale.  Although the number of new listings is keeping pace with last year, it is not enough to satisfy the demand.  The result is that buyers are buying, and sellers are selling.  10% more homes have sold this year than last year.  Likewise, prices have [...]

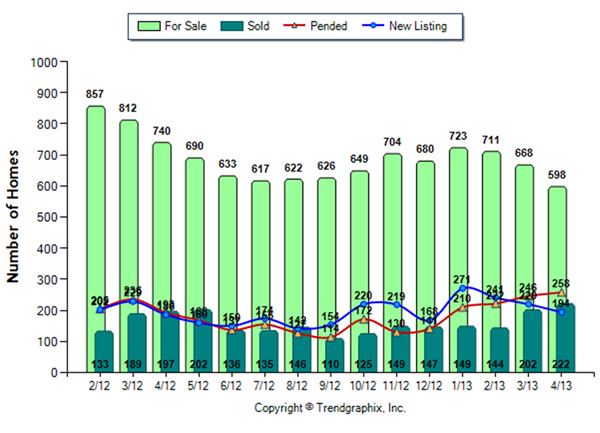
        Venice – State of the Market Report – April 2013

        The shelf is getting pretty bare. The above graph clearly depicts the housing resale trend in Venice since the first of the year: • Homes for Sale --- In January, 723; in April, 598. A 13% drop. • New Listings --- In January, 271; in April, 194. A 28% drop. • Pended Sales (Under Contract) --- In January, 210; in April, 258. A 19% increase. [...]
        1-10 of 12 Posts

        Let’s get to know each other.

        Do not fill in this field:

        By submitting this form I agree to receive marketing and customer service calls and text messages from Michael Saunders & Company. To opt out, you can reply 'stop' at any time or click the unsubscribe link in the emails. Consent is not a condition of purchase. Msg/data rates may apply. Msg frequency varies. Privacy Policy.

        This site is protected by reCAPTCHA and the Google Privacy Policy and Terms of Service apply.