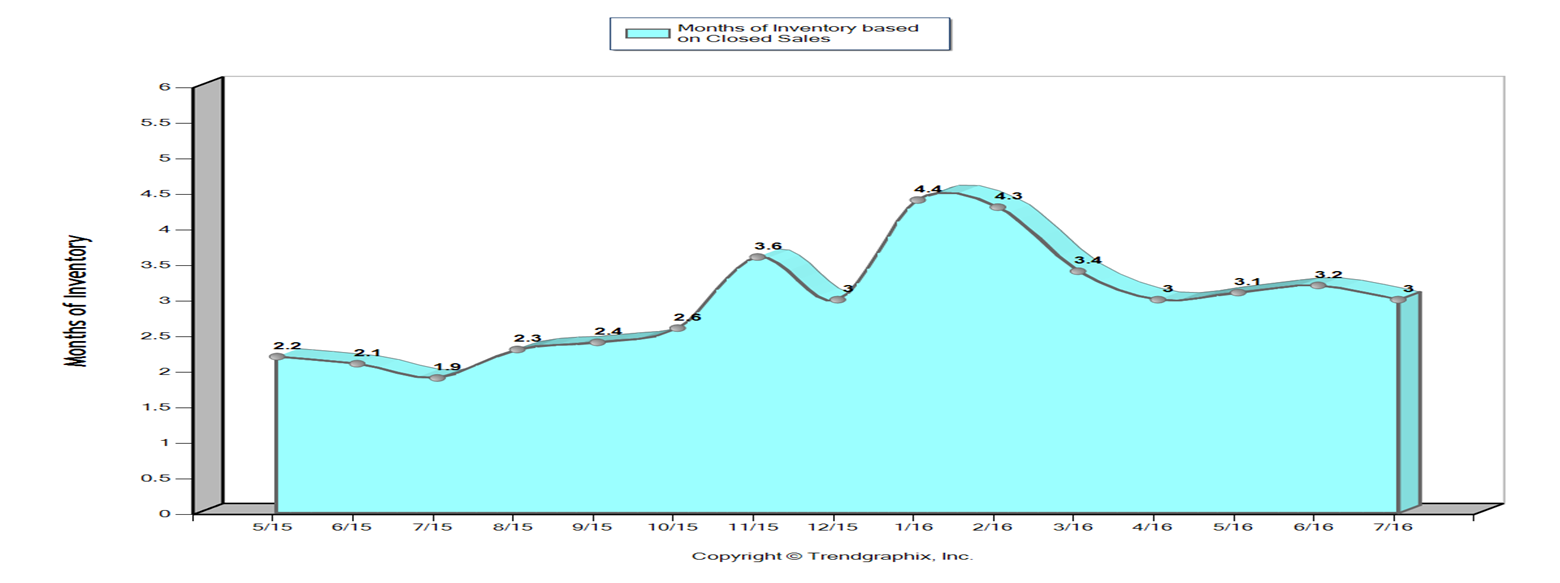
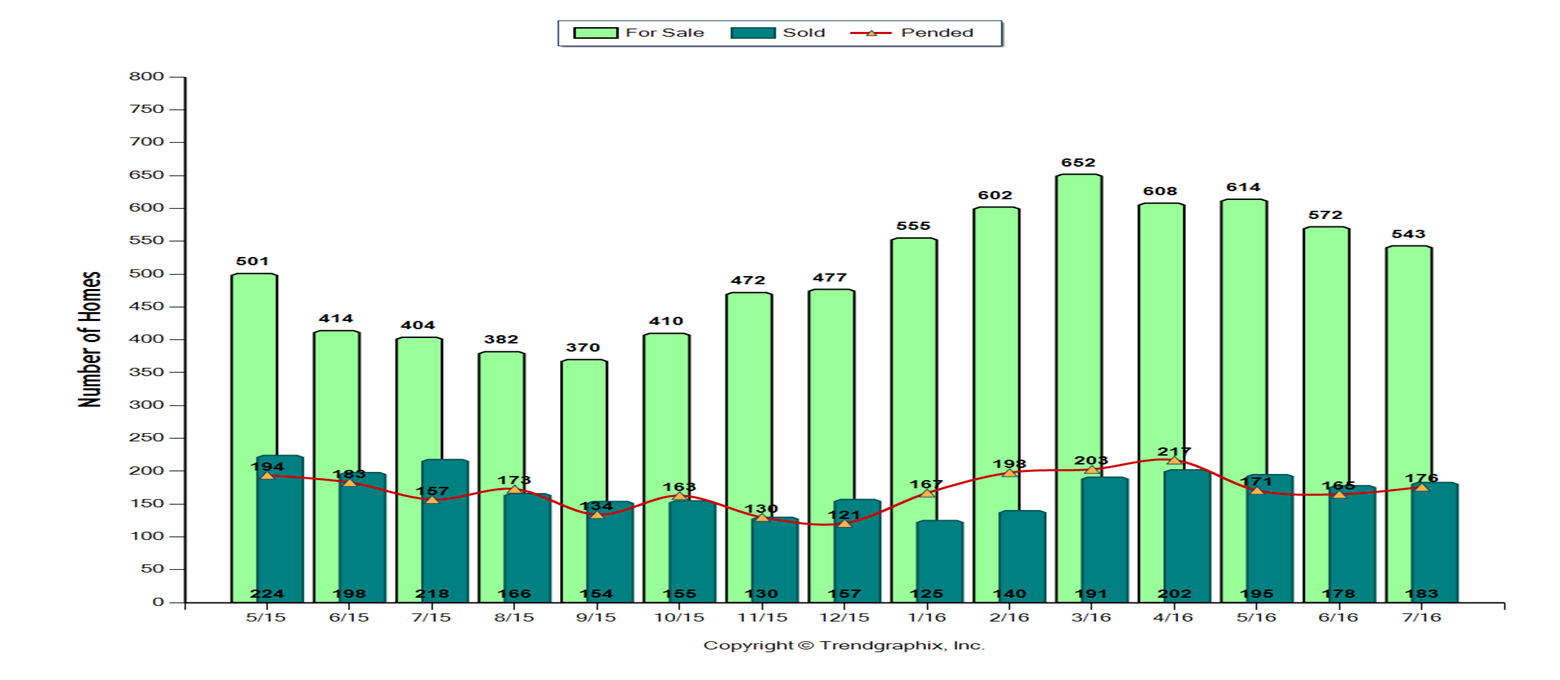
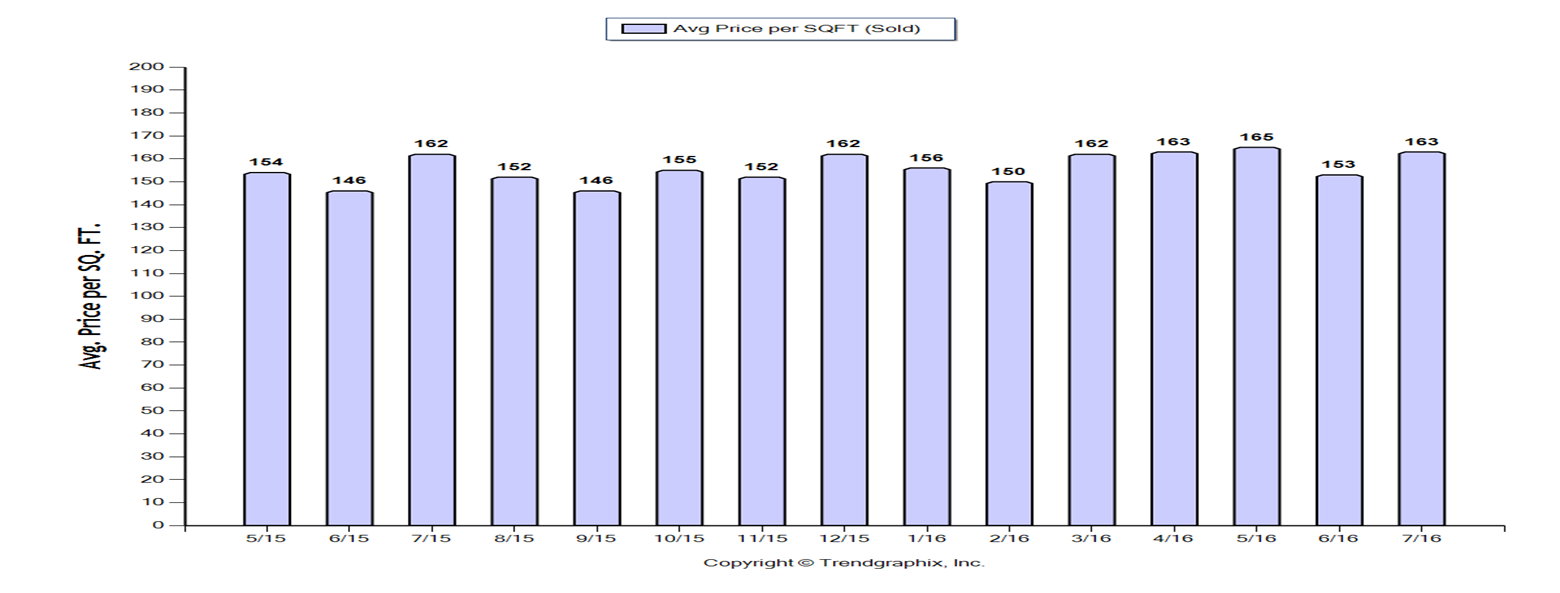
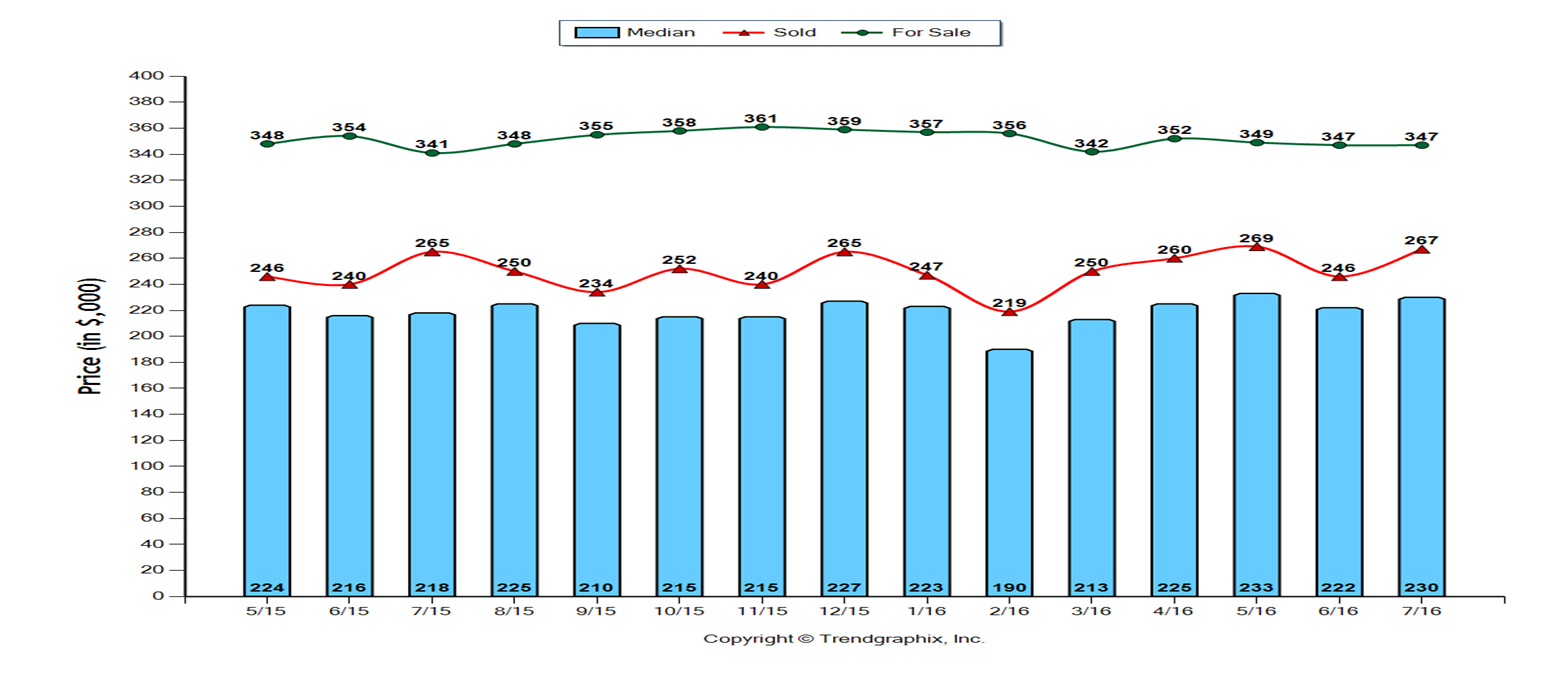
Inventory remains low. For the past 3 months there was a 3.1 month supply of homes for sale based on closed sales. Last year at this time there was a 2 month supply. Although a 3 month supply is low, and constitutes a Seller’s Market (6 months is considered a balanced market), the supply of homes is beginning to increase, resulting in a slowdown in the rate of appreciation. Not to be misunderstood, prices continue to increase, but not at the double digit appreciation rate of the past few years. There were 1,729 homes for sale during the most recent quarter, 31.1% more homes than the 1,319 homes for sale during the same quarter last year. Couple more homes for sale with less homes selling and going under contract, and you have prices appreciating at a slower pace. There were 556 closings during the past 3 months, 13.1% less than the 640 closings for the same time period last year. There were 512 signed contract during the past 3 months, 4.1% less than the 534 contracts signed from May through June 2015. Notwithstanding the foregoing, the home resale market remains strong. Prices still increased 4% this past quarter vs the same quarter last year. But, prices, although increasing, are not doing so at the 10% + rate we have grown accustomed to. For the current quarter, May, June, July 2016, the Average Sold Price per Square Foot in Venice was $160.50. It was $154.25 for the same quarter last year. Likewise, the Median Sold Price for the current quarter was $228,000, 4.1% higher than the same quarter last year when it was $219,000. Further, the Average Sold Price was similarly 4% higher this most recent quarter, $261,000 vs. the same quarter last year when it was $251,000. The Takeaway: Relative to the number of homes for sale, less homes are going under contract. Homes continue to sell for more than they would have garnered last year at this time. But, the rate of appreciation, year over year, has slowed to single digits, consistent with historical rates of appreciation. Please see the 4 graphs below: 1.) Months of Inventory Based on Closed Sales; 2.) Homes For Sale, Pended & Sold; 3.) Average Price per Square Foot – Sold Price; and 4.) Median, Sold & For Sale Price.