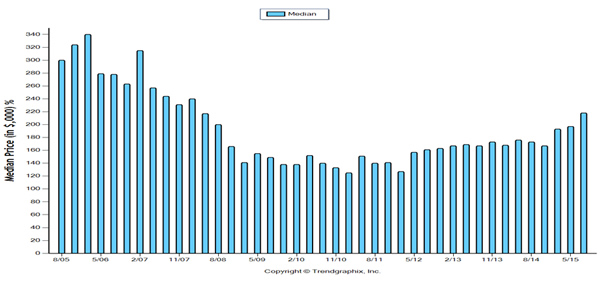
More homes are selling now than at any time within the past 10 years. And the supply is not being replenished fast enough. There are simply not enough new listings to serve the need. So much so that the last time we had less homes for sale was 10 years ago! See the charts below. For the current quarter, June 2015 – August 2015 there were on average 400 homes for sale on any given day. We have to go back to the same quarter 10 years ago, June 2005 – August 2005 to find less homes for sale, 357. The result is that homes are selling faster --- in 62 days and at ever increasing double digit prices. For the most recent quarter, June 2015 – August 2015, the average square foot sold price was $153. Compare that to $134 per square foot for the same quarter last year, a 14.2% increase. The median sold price for the current quarter was $218,000, as contrasted to $173,000 for the same quarter last year, a 26% increase! The average sold price was $252,000 this past quarter, whereas, last year this time it was $212,000, an 18.9% increase. By any definition this is a Seller’s market. Few homes for sale, resulting in quick sales and at accelerating prices. The $64,000 question: Are prices getting too high? The statistics indicate that prices are not too high, notwithstanding the annual double digit run-up in prices, which began in January 2012. Sold prices remain 30% less than what they were this same quarter, June 2015 – August 2015 from 10 years ago. 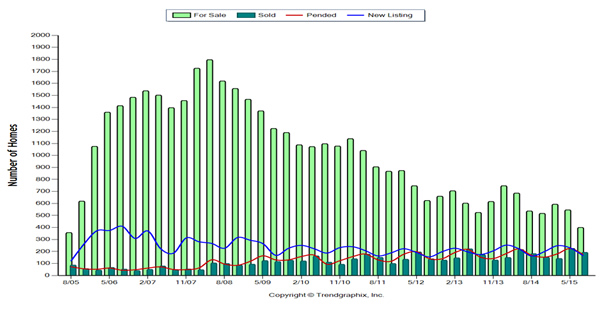
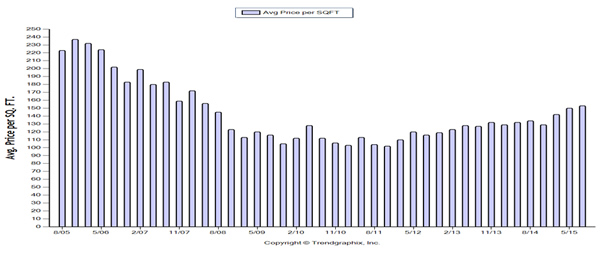
- Average Square Foot Sold Price. 4% less current quarter (June 2015 – August 2015) VS. same quarter 10 years ago. ($153 sq. ft. current quarter / $223 sq. ft. 10 years ago.)
- Median Price. 3% less current quarter (June 2015 – August 2015) VS. same quarter 10 years ago. ($218,000 current quarter / $300,000 10 years ago.)
- Average Sold Price. 6% less current quarter (June 2015 – August 2015) VS. same quarter 10 years ago. ($52,000 current quarter / $358,000 10 years ago.)