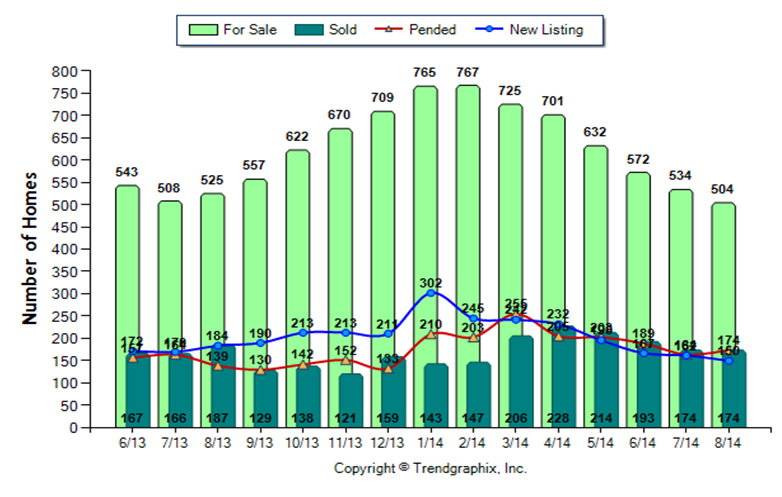
Sold prices have stabilized. In fact, there is some evidence that prices may be showing signs of modest depreciation. Consider the following:
- Inventory remains low --- 2.9 month supply based on closed sales.
- Buyers quickly emerge --- average days on the market, 77 days.
Nevertheless, notwithstanding the laws of supply and demand:
- Average sold price down --- 2.4% to $207,000.
- Average median sold price unchanged --- $168,000.
All real estate is local. So what is occurring in one community in Venice can vary from another. In a number of the communities in which I concentrate in, prices continue to appreciate at a strong pace. However, taking all of Venice as a whole, that is no longer the case --- at least insofar as the past month or two indicates. Whether this is a temporary market lull or a bell weather of a moderating market following a 2 year surge, will become self-evident as we approach the traditional “selling season”.
- Homes for Sale, Sold, Pended, New Listings & Inventory: Seller’s Market
- Homes for Sale: 504 homes; down 5.6% from last month, down 4% from last year.
- Homes Listed: 150 homes; down 7.4% from last month, down 18.5% from last year.
- Homes Closed: 174 homes; same as last month (0% change), down 7% from last year.
- Homes Placed Under Contract: 174 homes; up 6.1% from last month, up 25.2% from last year.
- Inventory (based on Closed Sales): 2.9 months; down 6.5% from last month, up 3.6% from last year.
- Average Days on Market: Neutral
- Days on Market: 77 days; down 11.5% from last month, up 16.7% from last year.
- Sold/List Price Ratio: Steady
- Sold/Original List Price %: 93%; same as last month (0% change), same as last year (0% change).
- Sold/Final List Price %: 96%; same as last month (0% change), up 1.1% from last year.
- Avg. Active List Price: Appreciating | Avg. Sold Price: Depreciating|Avg. Median Sold Price: Depreciating
- Average Active List Price: $307,000; up 0.7% from last month, up 14.6% from last year.
- Average Sold Price: $207,000; down 2.4% from last month, down 1.4% from last year.
- Average Median Sold Price: $168,000; same as last month (0% change), up 0.6% from last year.