July 1, 2012 – June 30, 2013: 10.2% Price Increase
The pace of sold homes (closed) and pended sales (under contract) continue unabated. For most recent months, including June, sold and pended sales outnumbered new listings by a factor of at least two (2) to one (1). Month in and month out there are simply not enough new listings to satisfy the demand. As a result, inventory remains low, currently at a three (3) month supply. Six (6) to seven (7) months is considered a balanced market between buyers and sellers. At a three (3) month supply, prices have nowhere to go but up. In fact, for the past twelve (12) months the average square foot sold price went up 10.2%. The $64,000 question or perhaps more appropriately, based on the median sold price in June of $178,000, the $178,000 question is whether prices will continue to escalate at the current pace. I don’t think so. We’ve experienced a pop, after years of depressed pricing; it was to be expected. However, if it were to continue unabated, that would foretell another bubble. I just don’t see it, particularly when the economy remains anemic, notwithstanding significant governmental intervention. Rather, as I have posited in previous posts, I believe it is more likely that over the next year prices will begin to modestly appreciate in accordance with historical averages of two (2) to five (5) percent.Last 2 years
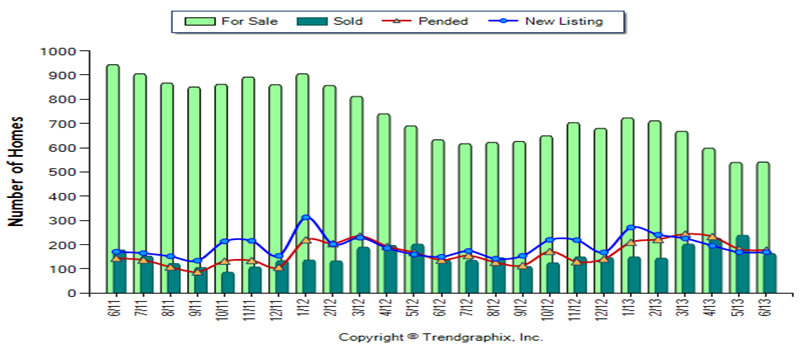
- Homes for Sale:
a. Current Month vs. Previous Month: 0.4% more homes for sale; 541 in June, 539 in May. b. Current vs. Same 12 Months 1 Year Ago: 22.2% less homes for sale; 640 on avg. July 2012 to June 2013, 823 on avg. July 2011 to June 2012.
- New Listings:
a. Current Month vs. Previous Month: No difference; 169 in June, 169 in May. b. Current vs. Same 12 Months 1 Year Ago: 3.2% more new listings; 196 on avg. July 2012 to June 2013, 190 on avg. July 2011 to June 2012.
- Sold Homes:
a. Current Month vs. Prior Month: 31.8% less homes sold; 163 in June, 239 in May. b. Current vs. Same 12 Months 1 Year Ago: 13.4% more homes sold; 161 on avg. July 2012 to June 2013, 142 on avg. July 2011 to June 2012.
- Pended Sales (Under Contract):
a. Current Month vs. Previous Month: 2.2% less pended sales; 178 in June, 182 in May. b. Current vs. Same 12 Months 1 Year Ago: 12.8% more pended sales; 176 on avg. July 2012 to June 2013, 156 on avg. July 2011 to June 2012.
Last 2 years
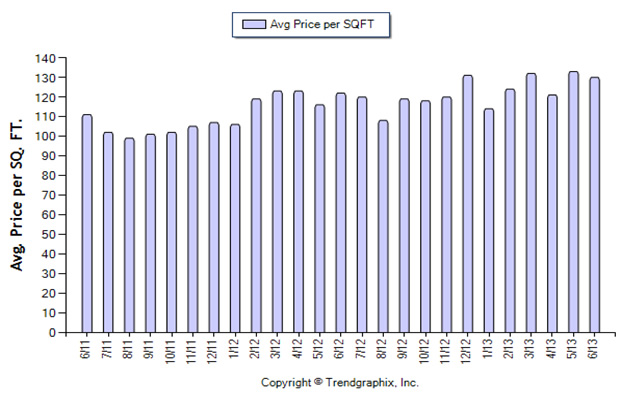
- Avg. Sq. Ft. Sold Price:
a. Current Month vs. Previous Month: 2.2% decrease in avg. sq. ft. sold price --- $130.1 in June, $133 in May. b. Current vs. Same 12 Months 1 Year Ago: 10.2% increase in avg. sq. ft. sold price; $123.4 on avg. July 2012 to June 2013, 112. on avg. July 2011 to July 2012.
Last 2 years
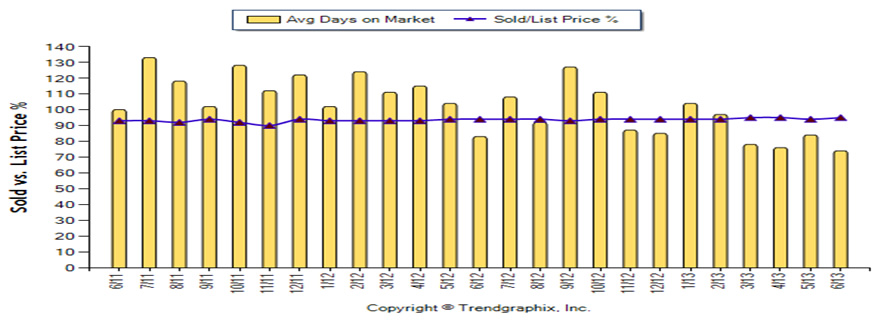
- Avg. Days on Market:
a. Current Month vs. Previous Month: 11.9% decrease in days on the market; 74 in June, 84 in Mayl. b. Current vs. Same 12 Months 1 Year Ago: 18.7% decrease in days on the market; 91 on avg. July 2012 to June 2013, 112 on avg. July 2011 to June 2012.
- Sold/List Price %:
a. Current Month vs. Previous Month: 1.1% decrease in the difference between the sold price and the final list price; 5% difference in June, 6% in May. b. Current vs. Same 12 Months 1 Year Ago: 1.1% decrease in the difference between the sold price and the final list price; 6% difference on avg. July 2012 to June 2013, 7% difference on avg. July 2011 to June 2012.
Last 2 years
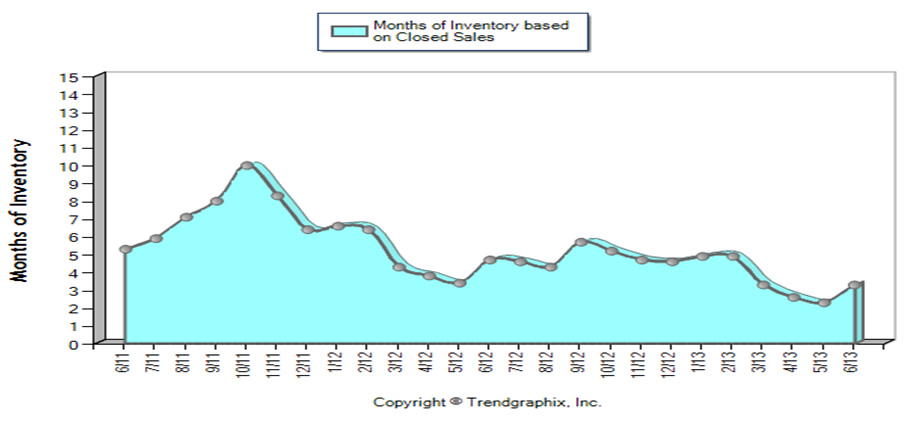
- Months of Inventory (Based on Closed Sales):
a. Current Month vs. Prior Month: 47.2% increase in inventory of homes for sale based on closed sales; 3.3 month supply in June, 2.3 month supply in April. b. Current vs. Same 12 Months 1 Year Ago: 31.4% decrease in inventory of homes for sale based on closed sales; 4 month supply on avg. July 2012 to June 2013; 6 month supply on avg. July 2011 to June 2012.