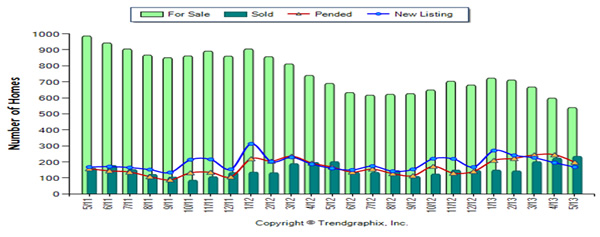
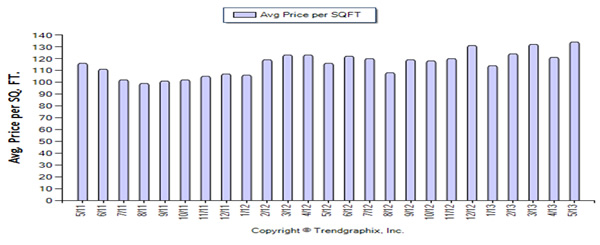
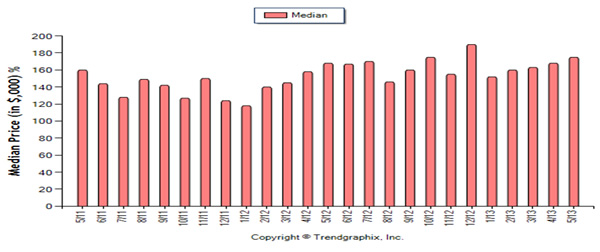
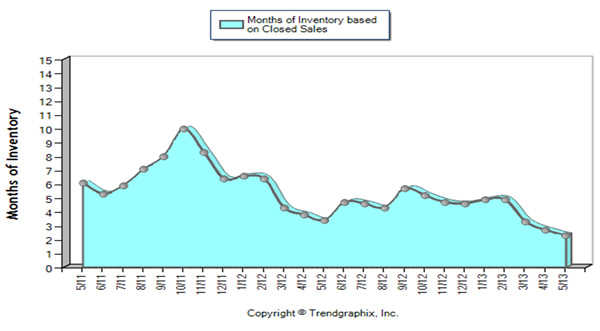
In Venice, there are fewer homes for sale; a lot fewer. Almost 25% fewer homes for sale. Although the number of new listings is keeping pace with last year, it is not enough to satisfy the demand. The result is that buyers are buying, and sellers are selling. 10% more homes have sold this year than last year. Likewise, prices have increased 10%.
- Homes for Sale:
- Current Month vs. Prior Month: 9.9% less homes for sale; 539 in May, 598 in April.
- Current vs. Same 12 Months 1 Year Ago: 23.7% less homes for sale; 648 on avg. June 2012 to May 2013, 849 on avg. June 2011 to May 2012.
- New Listings:
- Current Month vs. Prior Month: 13.8% less new listings; 168 in May, 195 in April.
- Current vs. Same 12 Months 1 Year Ago: 1.6% more new listings; 194 on avg. June 2012 to May 2013, 191 on avg. June 2011 to May 2012.
- Pended Sales (Under Contract):
- Current Month vs. Prior Month: 19.2% less pended sales; 198 in May, 245 in April.
- Current vs. Same 12 Months 1 Year Ago: 12.2% more pended sales; 175 on avg. June 2012 to May 2013, 156 on avg. June 2011 to May 2012.
- Sold Homes:
- Current Month vs. Prior Month: 4.9% more homes sold; 235 in May, 224 in April.
- Current vs. Same 12 Months 1 Year Ago: 9.7% more homes sold; 159 on avg. June 2012 to May 2013, 145 on avg. June 2011 to May 2012.
- Avg. Sq. Ft. Sold Price:
- Current Month vs. Prior Month: 10.3% increase in avg. sq. ft. sold price --- $133.8 in May, $121.3 in April.
- Current vs. Same 12 Months 1 Year Ago: 10.5% increase in avg. sq. ft. sold price; $122.8 on avg. June 2012 to May 2013, 111.1 on avg. June 2011 to May 2012.
- Avg. Days on Market:
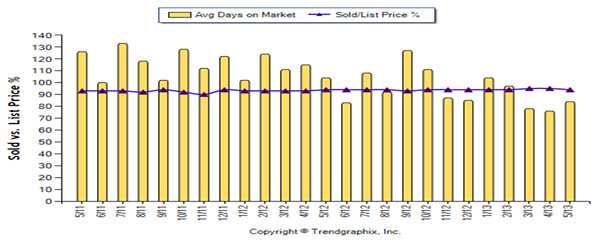
- Current Month vs. Prior Month: 10.5% increase in days on the market; 84 in May, 76 in April.
- Current vs. Same 12 Months 1 Year Ago: 18.6% decrease in days on the market; 92 on avg. June 2012 to May 2013, 113 on avg. June 2011 to May 2012.
- Sold/List Price %:
- Current Month vs. Prior Month: 1.1% increase in the difference between the sold price and the final list price; 6% difference in May, 5% in April.
- Current vs. Same 12 Months 1 Year Ago: 1.1% decrease in the difference between the sold price and the final list price; 6% difference on avg. June 2012 to May 2013, 7% difference on avg. June 2011 to May 2012.
- Months of Inventory (Based on Closed Sales):
- Current Month vs. Prior Month: 14.1% decrease in inventory of homes for sale based on closed sales; 2.3 month supply in May, 2.7% in April.
- Current vs. Same 12 Months 1 Year Ago: 30.4% decrease in inventory of homes for sale based on closed sales; 4.4 month supply on avg. June 2012 to May 2013; 6.3 month supply on avg. June 2011 to May 2012.