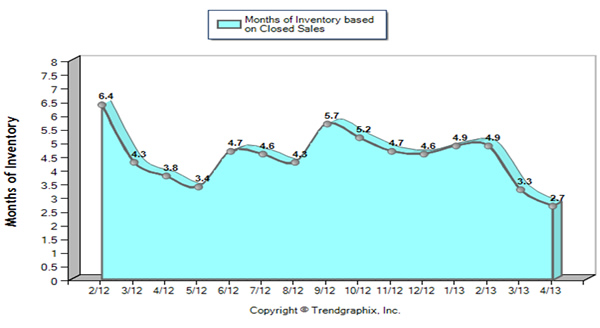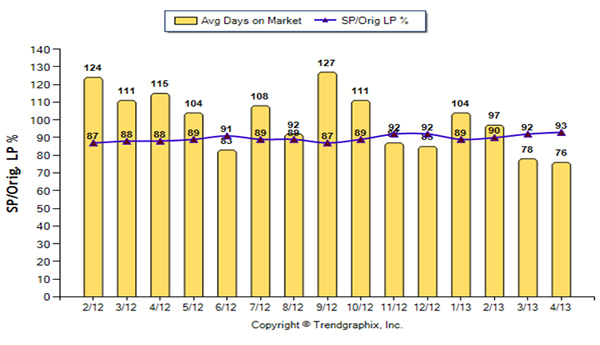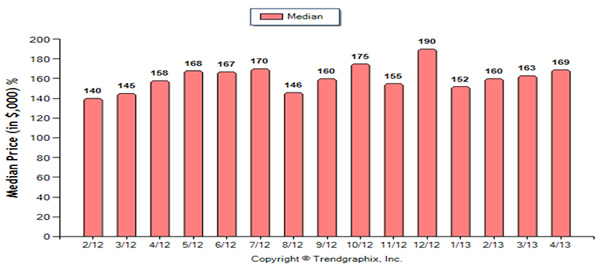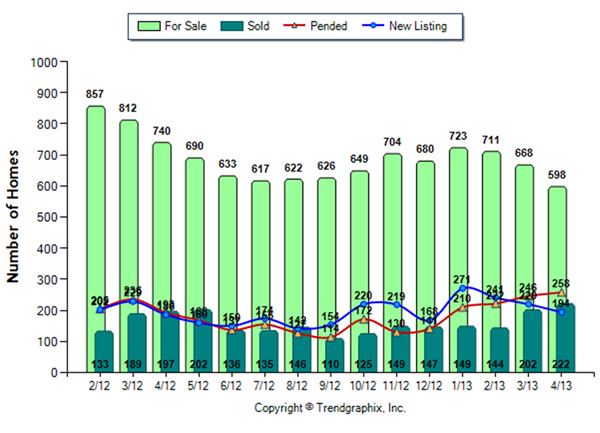
The shelf is getting pretty bare. The above graph clearly depicts the housing resale trend in Venice since the first of the year: • Homes for Sale --- In January, 723; in April, 598. A 13% drop. • New Listings --- In January, 271; in April, 194. A 28% drop. • Pended Sales (Under Contract) --- In January, 210; in April, 258. A 19% increase. • Sold --- In January, 149; in April, 222. A 33% increase. It is particularly revealing that Pended Sales continue to accelerate, even as New Listings decrease. This runs counter to last year at this time, April 2012, when both Pended Sales and New Listings dropped from the previous month (See graph above). The net effect is that as inventory continues to shrink, homes are selling faster and at higher prices than this time last year. There is only a 2.7 month inventory based on Closed Sales. On average homes are selling in only 76 days (2 ½ months), and at 93% of the Original List Price. Accordingly, in April 2013 the Median Price of Sold Homes was $169,000; a 3.7% increase over March 2013 ($163,000); a 7% increase over the same month last year ($158,000); and a 10.7% increase for the last 3 months vs. the same 3 months last year ($165,000 from February 2013 to April 2013 vs. $149,000 from February 2012 to April 2012). See graphs below: Months of Inventory Based on Closed Sales; Average Days on Market & Sale Price/List Price %; and Median Sold Prices.