1st Quarter 2013 vs. 1st Quarter 2012
- HOMES for SALE: 18% Decrease.
- NEW LISTINGS: 28% Decrease.
- PENDED SALES: 11% Increase.
- SOLD HOMES: 6.5% Increase.
- INVENTORY: 23% Decrease.
- AVG DAYS ON MRKT: 18% Decrease.
- AVG LIST PRICE: 0.8% Increase.
- SOLD PRICES: 6% Increase.
A properly priced home will garner a higher sale price and result in a faster sale. Comparing the first quarter of 2013 (January thru March) to the first quarter of 2012, sold homes went pending/under contract in 2 ½ months, a 3 week improvement over the same period last year. Sold prices increased almost 6%, from $124/square foot to $131.40/square foot; while the average list price barely increased 1%, from $266,000 to $268,000. Nevertheless, although there were 28% less new listings and 18% fewer homes for sale, the pace of sold homes/closings accelerated at a 6.5% rate. Although more homes are selling relative to a diminishing supply of homes for sale, the increase in prices has been modest. With inventory as low as it is (4 months), the natural laws of supply and demand should instill price increases greater than the historical norm. But that’s not happening. The fact is the economy is anemic. Incomes are not increasing. Unemployment remains high. Consumer confidence has declined
(see March 26, 2013 Conference Board Consumer Confidence Index below*). The basis for only modest real estate price increases in a low inventory, inflation and interest rate environment are the following:
- The perception that a bottom has been established.
- Stringent lender underwriting.
- 70% of buyers are paying cash, and therefore, conservative in the allocation of their acquired wealth.
- Our buyer market is primarily retiring or soon to retire Baby Boomers.
The good news for Venice and the greater Sarasota market is that Baby Boomers are less affected by unemployment and consumer confidence because their timeline is narrowing. Nevertheless, lessons learned in the past decade have made them cautious and shrewd consumers in all economic market sectors, not just housing. In such an environment, barring unforeseen circumstances, home prices are likely to continue to increase no more than 2% – 5% a year. Furthermore, we should expect a steady stream of buyers over the summer months. There is a specific pool of buyers, such as teachers, who can only shop for real estate during the summer months, when they naturally have time off from work. All of the foregoing should weigh heavily in any decision regarding the purchase or sale of a home. Whether one is a buyer or seller, there seems little reason to wait on the sidelines any longer.
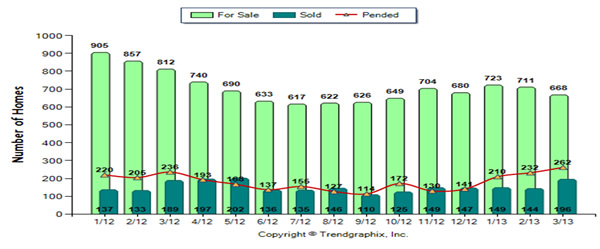 Homes for Sale
 --- In March there were 668 homes for sale; in February there were 711; and 812 in March 2012. That represents a 6% drop from the prior month, and 17.7 % less than the same month 1 year ago. Further, there were 18.3% less homes for sale for the first quarter of this year vs. the same quarter one year ago.
New Listings --- Likewise, there were 9.3% less listings in March (215) vs. February (237), and February’s listings were 10.4% lower than January (268). Comparing March 2013 to March 2012, new listings were down 6.1%; and, for the first quarter of 2013 vs. the first quarter of 2012, there were 2.8% less new listings.
Pending Sales – Pending sales (homes under contract but not closed) showed double digit percentage month over month material increases: 262 pending sales in March 2013, 232 in February 2013, and 2010 in January 2013. Particularly noteworthy is that there were 11% more pending sales in March 2013 (262) vs. March 2012 (236), and the first quarter of 2013 had 11% more pending sales.
Sold Homes --- Typically, closings for March roared in like a lion: there were 196 sold homes in March 2013, 36.1% more than the 144 sold homes in February. Closings also increased by 3.7% from March 2013 over the same month last year, and by 6.5% for the current first quarter versus the same quarter last year.
Sold Prices --- Home prices continue to increase: In March 2013 the average square foot sold price was $131.40 vs. $124 in February, a 5.9% increase. The increase was 6.6% over the same month last year, and 6.2% for the first quarter of this year vs last year’s first quarter.
Inventory --- Based on closed sales, at a 3.5 month supply of homes for sale in March 2013, inventory is very low, dropping 31% from February’s already low 5 month supply. The current 3 month supply is also 20.7% less than the 4 month supply in March 2012. On a first quarterly basis there was an average 4 month supply from January thru March 2013; for the first quarter 2012 it was 6 months --- that represents a 23.3% drop in inventory for the most recent quarter vs. the same quarter last year. Six months is considered a balanced market between sellers and buyers.
Average Days on Market--- On average it took only 78 days to sell a home in March 2013; that represents a 19.6% improvement over the 97 day average in February 2013; and, a 29.7% improvement over the 111 day average in March 2012. For the first quarter of 2013, 92 days was the average time on the market; it was 112 days for the first quarter of 2012, a 17.9% improvement.
Average Active List Price --- Minimal Change: $269,000 in March 2013, $268,000 in February 2012 (0.4% increase); $265,000 in March 2012 (1.5% increase). Fort the first quarter of 2013 the average active list price was $268,000 vs. $266,000 for the first quarter of 2012 (0.8% increase).
List Price % vs. Sold Price % --- Month in and month out the difference between final list price and sold price is consistently at a 5 to 7% spread. So, at a 6% difference between list and likely selling price … that is the point at which a home will attract buyers and negotiations will commence. ________________________________________________________________________________________________________
* The Conference Board Consumer Confidence Index® Declines in March
26 Mar. 2013
NEW YORK, March 26, 2013…The Conference Board
Consumer Confidence Index®, which had improved in February, declined in March. The Index now stands at 59.7 (1985=100), down from 68.0 in February. The Present Situation Index decreased to 57.9 from 61.4. The Expectations Index declined to 60.9 from 72.4 last month. The monthly
Consumer Confidence Survey®, based on a probability-design random sample, is conducted for The Conference Board by Nielsen, a leading global provider of information and analytics around what consumers buy and watch. The cutoff date for the preliminary results was March 14. Says Lynn Franco, Director of Economic Indicators at The Conference Board: “Consumer Confidence fell sharply in March, following February’s uptick. This month’s retreat was driven primarily by a sharp decline in expectations, although consumers were also more pessimistic in their assessment of current conditions. The loss of confidence, particularly expectations, mirrors the losses experienced this past December and January. The recent sequester has created uncertainty regarding the economic outlook and as a result, consumers are less confident.” Consumers’ appraisal of current conditions declined in March. Those saying business conditions are “good” decreased to 16.0 percent from 17.6 percent, while those stating business conditions are “bad” increased to 29.3 percent from 28.2 percent. Consumers’ assessment of the labor market was mixed. Those claiming jobs are “plentiful” decreased to 9.4 percent from 10.1 percent, but those claiming jobs are “hard to get” edged down to 36.2 percent from 36.9 percent. Consumers are once again pessimistic about the short-term outlook. Those expecting business conditions to improve over the next six months decreased to 14.4 percent from 18.0 percent, while those anticipating business conditions to worsen increased to 18.3 percent from 16.6 percent. Consumers’ outlook for the labor market was also less favorable. Those expecting more jobs in the months ahead declined to 12.3 percent from 16.1 percent, while those expecting fewer jobs increased to 26.6 percent from 22.1 percent. The proportion of consumers expecting their incomes to increase fell to 13.7 percent from 15.8 percent, while those expecting a decrease edged down to 18.0 percent from 19.3 percent.