Inventory remains low, below 6 months. When properly priced, no greater than 7% from fair market value, buyers quickly emerge. That song remains the same. The real eye opener, as I have posited in prior blogs, is that prices, on average, are likely to increase only 2% - 3% per year. The fact is, for the past 12 months, March 1, 2012 through February 28, 2013, the average sold price per square foot in Venice increased 2.7%. This is concurrent with the 100 year historical average. It would seem that with inventory as low as it is, the natural laws of supply and demand would dictate price increases greater than the historical norm. But that’s not happening. The fact is the economy is merely creeping along, incomes are not increasing, unemployment remains high; accordingly, inflation and interest rates remain low (along with a little help from Uncle Sam). In such an environment, barring unforeseen circumstances, home prices are likely to continue to increase no more than 2% – 3% a year. So, whether buying or selling, there is no reason to wait on the sidelines any longer. 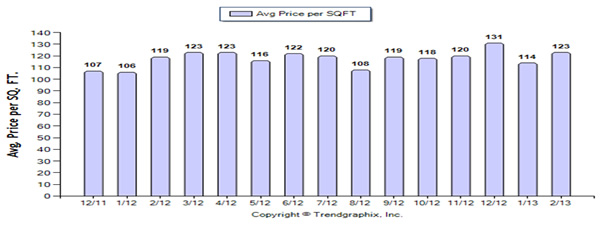 Homes for Sale --- In February there were 711 homes for sale; in January there were 723; and 857 in February 2012. That represents a decrease of 1.7% over the prior month, and 17 % less than the same month 1 year ago. New Listings --- Likewise, new listings are down 10.4% from last month: 240 new listings in February, whereas, there were 268 in January. Last month I posted in my blog that new listings went up a dramatic 60% from December 2012 to January 2013. I raised the issue, “whether or not this dramatic increase is seasonal only or indicative of an increase in inventory is too early to predict”. Considering that new listings went down 10% this past month, it would appear that the 60% increase in January was seasonal only, and not indicative of a rising tide of seller’s proclivity to list their homes for sale. Pending Sales – Pending sales (under contract but not closed) increased 15.3%. Pending sales are generally a reliable indicator of closing activity over the next two (2) months. In January there were 249 homes under contract, 216 last month, and 205 the same month one (1) year ago. The result is a further diminution of inventory as pending sales are out-pacing new listings. Sold Homes --- There were 141 closings/sold homes in February, 5.4% less than the 149 closings in January, although 6% greater than the 133 sold homes in February 2012. Sold Prices --- Home prices increased: In February the average square foot price of a sold home was $123/sq. ft., up 8.3% from $114/sq. ft. in January; and up 4.1% from $119/sq. ft. in February 2012. However, the immediate prior 12 month average is $119.31. This indicates that sold prices increased 2.7% from March 1, 2012 to February 28, 2013. That is consistent with the 100 year historical average. Inventory --- Inventory remains low, fundamentally unchanged. There was a five (5) month supply in February and a 4.9 month supply in January. One year ago this month there was a 6.4 month supply; that was the last time it was over 6 months. Six months is considered a balanced market between sellers and buyers. Average Days on Market--- It took 98 days to sell a home in February, 104 days in January, and 124 days a year ago February. List Price % vs. Sold Price % --- On average there was a 10% spread between the original list price and the eventual sold price, and a 6% spread between the final list price and the sold price. Month in and month out the difference between final list price and sold price is consistently at a 6 to 7% spread. So, at a 6% difference between list and likely selling price … that is the point at which a home will attract buyers and negotiations will commence.
Homes for Sale --- In February there were 711 homes for sale; in January there were 723; and 857 in February 2012. That represents a decrease of 1.7% over the prior month, and 17 % less than the same month 1 year ago. New Listings --- Likewise, new listings are down 10.4% from last month: 240 new listings in February, whereas, there were 268 in January. Last month I posted in my blog that new listings went up a dramatic 60% from December 2012 to January 2013. I raised the issue, “whether or not this dramatic increase is seasonal only or indicative of an increase in inventory is too early to predict”. Considering that new listings went down 10% this past month, it would appear that the 60% increase in January was seasonal only, and not indicative of a rising tide of seller’s proclivity to list their homes for sale. Pending Sales – Pending sales (under contract but not closed) increased 15.3%. Pending sales are generally a reliable indicator of closing activity over the next two (2) months. In January there were 249 homes under contract, 216 last month, and 205 the same month one (1) year ago. The result is a further diminution of inventory as pending sales are out-pacing new listings. Sold Homes --- There were 141 closings/sold homes in February, 5.4% less than the 149 closings in January, although 6% greater than the 133 sold homes in February 2012. Sold Prices --- Home prices increased: In February the average square foot price of a sold home was $123/sq. ft., up 8.3% from $114/sq. ft. in January; and up 4.1% from $119/sq. ft. in February 2012. However, the immediate prior 12 month average is $119.31. This indicates that sold prices increased 2.7% from March 1, 2012 to February 28, 2013. That is consistent with the 100 year historical average. Inventory --- Inventory remains low, fundamentally unchanged. There was a five (5) month supply in February and a 4.9 month supply in January. One year ago this month there was a 6.4 month supply; that was the last time it was over 6 months. Six months is considered a balanced market between sellers and buyers. Average Days on Market--- It took 98 days to sell a home in February, 104 days in January, and 124 days a year ago February. List Price % vs. Sold Price % --- On average there was a 10% spread between the original list price and the eventual sold price, and a 6% spread between the final list price and the sold price. Month in and month out the difference between final list price and sold price is consistently at a 6 to 7% spread. So, at a 6% difference between list and likely selling price … that is the point at which a home will attract buyers and negotiations will commence.