Groundhog Day may not have come until February 2nd, but in January both Sellers and Buyers came out of hiding. Sixty percent (60%) more homes were listed in January than the prior month in December; likewise, sixty percent (60%) more homes went under contract in January. Meanwhile, the number of sold homes (closings) in January stayed substantially the same. The result is that the number of available homes for sale has remained relatively constant. However, the price of sold homes, on an average square foot basis, actually went down. Whether this is a precursor of buyer resistance to continued price increases or an isolated dip is too early to determine. The results for February and March should be quite instructive of how prices will continue to trend. 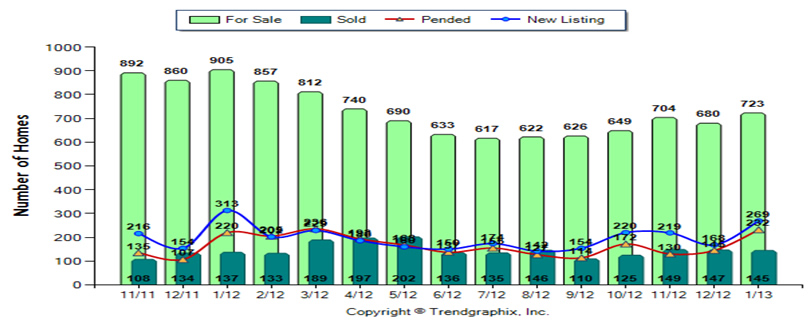 Homes for Sale --- In January there were 702 homes for sale; in December there were 680; and 905 in January 2012. That represents an increase of 6.3% over the prior month, and 20.1 % less than the same month 1 year ago. New Listings --- Likewise, new listings are up 60.1% from last month: 269 new listings in January, whereas, there were only 168 in December. Whether or not this dramatic increase is seasonal only or indicative of an increase in inventory is too early to predict. Pending Sales – Similarly, pending sales (under contract but not closed) increased 60%. Pending sales are generally a reliable indicator of closing activity over the next two (2) months. In January there were 232 homes under contract, and only 145 pending sales last month. Sold Homes --- Approximately the same number of homes sold/closed in January, 145 sold homes; in December 147 homes sold. Sold Prices --- Prices, went down 12.2%, on an average square foot sold basis; $115/square foot in January, from $131/square foot in December. Segregating distressed (short sales and foreclosures) from non-distressed properties: distressed properties went down 15.2%; non-distressed properties went down 9.7%. However, at an average sold price of $115/square foot, it was 9% greater than the $106/square foot for the same month last year. Inventory --- Inventory remains low. In January there was only a 5 month supply. Since last March, inventory has stayed under 6 months. Six months is considered a balanced market between sellers and buyers. Average Days on Market Sold vs. List Price% --- It took longer to sell a home in January; 104 days was the average number of days a home remained active. In December 2012 a home was listed for an average of 85 days before it went pending. Sold vs. List Price% --- What remains a constant is that homes sell when the final list price is within 6% of the selling price. There was a 6% spread in January, as there has been in almost every month since December 2011.
Homes for Sale --- In January there were 702 homes for sale; in December there were 680; and 905 in January 2012. That represents an increase of 6.3% over the prior month, and 20.1 % less than the same month 1 year ago. New Listings --- Likewise, new listings are up 60.1% from last month: 269 new listings in January, whereas, there were only 168 in December. Whether or not this dramatic increase is seasonal only or indicative of an increase in inventory is too early to predict. Pending Sales – Similarly, pending sales (under contract but not closed) increased 60%. Pending sales are generally a reliable indicator of closing activity over the next two (2) months. In January there were 232 homes under contract, and only 145 pending sales last month. Sold Homes --- Approximately the same number of homes sold/closed in January, 145 sold homes; in December 147 homes sold. Sold Prices --- Prices, went down 12.2%, on an average square foot sold basis; $115/square foot in January, from $131/square foot in December. Segregating distressed (short sales and foreclosures) from non-distressed properties: distressed properties went down 15.2%; non-distressed properties went down 9.7%. However, at an average sold price of $115/square foot, it was 9% greater than the $106/square foot for the same month last year. Inventory --- Inventory remains low. In January there was only a 5 month supply. Since last March, inventory has stayed under 6 months. Six months is considered a balanced market between sellers and buyers. Average Days on Market Sold vs. List Price% --- It took longer to sell a home in January; 104 days was the average number of days a home remained active. In December 2012 a home was listed for an average of 85 days before it went pending. Sold vs. List Price% --- What remains a constant is that homes sell when the final list price is within 6% of the selling price. There was a 6% spread in January, as there has been in almost every month since December 2011.