Zip Codes: 34285, 34292, 34293
Inventory, the supply of homes for sale based on closed sales, although increasing over the last few months, is less than we have recently experienced for this time of year. Further, the number of pending sales, under contract not closed, which is usually a reliable predictor of the next two (2) months closed sales, jumped significantly in October. The inventory of homes available for sale is trending downward, towards a fairly balanced six month supply. Accordingly, I am holding that prices have reached a “new bottom” in Venice. Due to global economic market conditions I do not foresee sale price increases, but, barring unforeseen circumstances and/or events, the “new bottom” is likely to hold. I do expect the number of homes sold will increase. What does this mean for you? Prices have stabilized, it is anticipated that they will remain at current levels for the foreseeable future, and interest rates are at historic lows. This is a very favorable time to sell or buy your home. Be forewarned: it must be priced competitively. Number of Homes for Sale: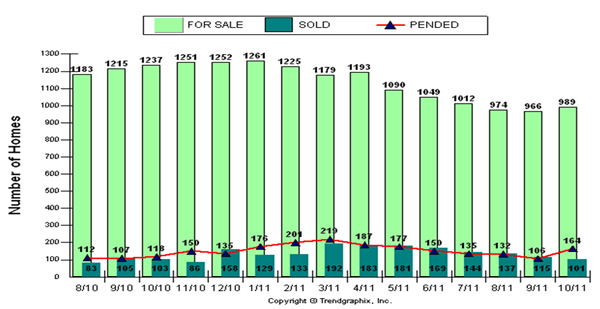
- As of October 30, 2011, there were 20% less homes available for sale versus the same time last year: October 2011, 989 homes for sale; October 2010, 1237 homes for sale.
- Although there were less homes for sale, the actual number of homes sold, 101 sales in October 2011, was only 1.9% less than the 103 homes sold in October 2010.
- Pending sales are usually a good indicator of future closed sales activity. Strikingly, the number of pending sales (under contract, not closed), jumped significantly, 54.7% from the previous month. There were 164 pending sales in October 2011, and only 106 in September 2011. This indicates that home sales will likely be strong for at least the next two months, November and December 2011.
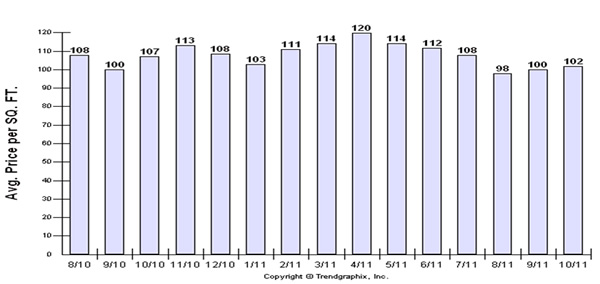
- Prices, on an average square foot basis, are close to their lowest levels, year to date.
- However, they do appear to be stabilizing at, what I am calling, a “new bottom”, hovering at around $100 per square foot: $98/sq. ft. in August 2011, $100/sq. ft. in September 2011, and $102/sq. ft. in October 2011. This is 4.9% less than the $105/ sq. ft. average for the same quarter one (1) year ago.
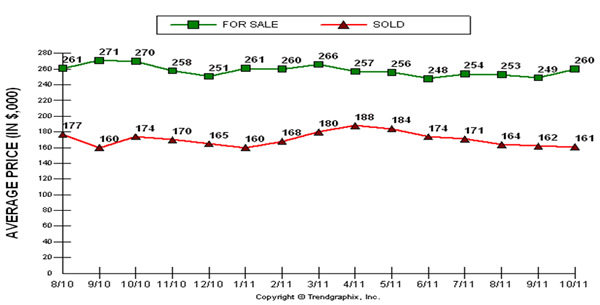
- Likewise, the average sold price is at its lowest levels for the year, $161,000 in October 2011. This is fundamentally the same as the $162,000 last month, and $164,000 in August 2011. It is 4.7% less than the $170,000 average sold price for the same quarter last year.
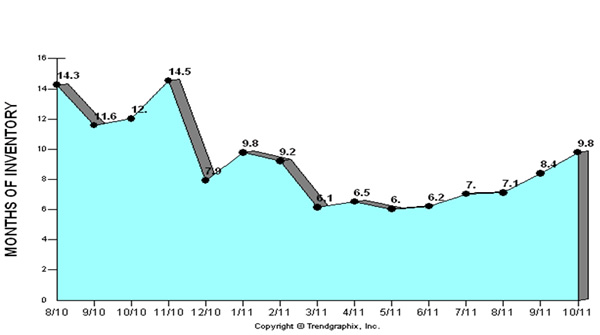
- As is typical for this time of year, the inventory of homes available for sale, based on closed sales, has been increasing since the 6 month low in May. Currently, there is a 9.8 month supply of homes available for sale, 16.6% increase over the 8.4 month supply last month.
- However, it has not exceeded the concurrent high of 9.8 month’s supply in January 2011.
- The current supply of inventory is 33.8% less than the 12.5 month supply for the same quarter last year; it is 18.5% less than the 12 month supply for the same month one year ago, October 2010.